Copyright Microburbs Pty Ltd 2014-
2025
.
Contact us
for licensing
Close
GET REPORT
New
Explorer
Profile Page
Logout
Sign Up
Login
Blog
Products
Subscriptions
Suburb Finder
Suburb Reports
Suburb DataExplorer
Free Data Consultation
API Access
Consulting Services
AI Property Finder
Coming Soon
Suburb Finder
2025 Suburb Reports
AI Property Finder
Profiles
People & Lifestyle
Crime & Disadvantage
Real Estate
Affluence & Economy
Environment
Nearby Suburbs
Northhead
Woolgar
Lyndhurst (Qld)
Porcupine
Bellfield (Qld)
Forsayth
Esmeralda
Einasleigh
Real Estate Market: Is Gilberton (Etheridge - Qld) QLD 4871 a Good Suburb to Buy Into?
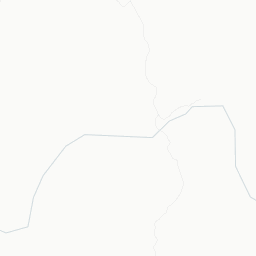
Housing Supply in Gilberton (Etheridge - Qld)
Gilberton (Etheridge - Qld) Real Estate Investor Report
Sample Graphic
The higher the supply score the more supply is on the market, both current and future.
Sources: ABS, GEOSPATIAL and Microburbs, 2002 - 2023
Gilberton (Etheridge - Qld)
76.9%
Gilberton (Etheridge - Qld)
76.9%
Queensland
61.6%
Queensland
61.6%
Compare
Suburbs
Field
Value
VS Queensland
Trend
Development applications
0
Bottom 38%
Data for Jun 2025
Developments
7.8
Top 20%
Data for Jul 2023
Housing Stock Quality Indicator
Total new residential buildings value (SA2)
Premium
Premium
Premium
Housing Stock Quality in Gilberton (Etheridge - Qld)
The higher the score, the higher the quality of the houses and units.
Sources: ABS, GEOSPATIAL and Microburbs, 2006 - 2023
Field
Value
VS Queensland
Trend
Houses
100.0%
Top 31%
Data for Jan 2021
Average bedrooms - all homes
2.3
Bottom 34%
to Jan 2021
NBN connection: fibreoptic cable to node
0.0%
Bottom 37%
Data for Jun 2023
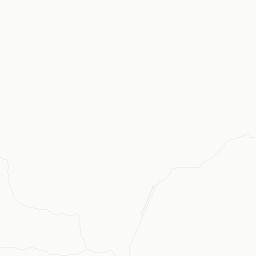
Development Restrictions in Gilberton (Etheridge - Qld)
Gilberton (Etheridge - Qld) Zoning Map
Sample Graphic
The higher the score, the more easily density can be increased.
Sources: GEOSPATIAL, TORREN and Microburbs, 2011 - 2023
Gilberton (Etheridge - Qld)
37.0%
Gilberton (Etheridge - Qld)
37.0%
Queensland
36.4%
Queensland
36.4%
Compare
Suburbs
Field
Value
VS Queensland
Trend
Heritage sites total area
0.7 sq km
Top 2%
Data for Jun 2023
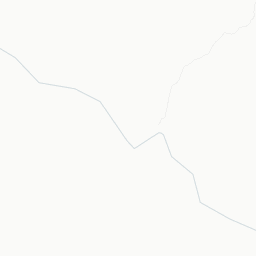
Risk in Gilberton (Etheridge - Qld)
Gilberton (Etheridge - Qld) Risk Report
Sample Graphic
The higher the score, the more exposed households are to financial stress.
Sources: ABS, Property Listings, TORREN and Microburbs, 2006 - 2023
Gilberton (Etheridge - Qld)
11.5
Gilberton (Etheridge - Qld)
11.5
Queensland
28.1
Queensland
28.1
Compare
Suburbs
Field
Value
VS Queensland
Trend
Housing Affordability Index
23
Bottom 18%
Data for Jun 2023
Rent Affordability Index (Houses)
81
Top 30%
Data for Jun 2023
Rent Affordability Index (Units)
78
Top 35%
Data for Jun 2023
Mortgage as a percent of income
76.6%
Top 1%
Data for Jan 2021
Housing Demand in Gilberton (Etheridge - Qld)
The higher the score, the more demand their is for housing in the area, both current and future.
Sources: ABS, TORREN and Microburbs, 2006 - 2030
Gilberton (Etheridge - Qld)
21.3%
Gilberton (Etheridge - Qld)
21.3%
Queensland
31.6%
Queensland
31.6%
Compare
Suburbs
Field
Value
VS Queensland
Trend
Net internal migration (LGA)
Premium
Premium
Premium
Future Population (SA2)
864
Bottom 5%
12% to Dec 2046
Historical Population (SA3)
33500
Bottom 18%
19% to Dec 2023
Historical population growth
Premium
Premium
Premium
Population (LGA)
747
Bottom 7%
25% to Dec 2030
Population Projection (LGA)
Premium
Premium
Premium
LGA Details (1)
Headline
Place
Datetime
Local government area
Etheridge
Loading entities ..
+
−
Leaflet
Subscribe
to see the map content. See samples:
Surry Hills (NSW)
St Kilda (Vic.)
Fortitude Valley
Kent Town
Northbridge (WA)
Darwin City
Glenorchy (Tas.)
Expand ↗️
Loading Choropleth Data
Min
Max
Subscribe
to see the timeline. See samples:
Surry Hills (NSW)
St Kilda (Vic.)
Fortitude Valley
Kent Town
Northbridge (WA)
Darwin City
Glenorchy (Tas.)
Profiles
People & Lifestyle
Crime & Disadvantage
Real Estate
Affluence & Economy
Environment
Nearby Suburbs
Northhead
Woolgar
Lyndhurst (Qld)
Porcupine
Bellfield (Qld)
Forsayth
Esmeralda
Einasleigh
.png)